Colligative Properties: Freezing Point Depression
Introduction
The physical properties of solutions that depend on the number of dissolved
solute particles and not their
specific type are known as colligative properties. These include freezing point
depression, osmotic pressure,
and boiling point elevation. In today's experiment you will explore the changes
in freezing point behavior of solutions in which t-butyl
alcohol (2-methyl-2-propanol) is the solvent.
Freezing point depression occurs when a solute is added to a solvent producing
a solution having lower freezing
point temperature than the pure solvent. The temperature decreases by an amount
ΔTf
given by the following
formula:
ΔTf = Kf cm
where Kf is the freezing point depression constant (characteristic
of the solvent) and cm is the molal
concentration of the
solution in moles of solute particles per kilogram of solvent (moles/kg). One
way to understand the freezing
point depression effect is to consider the solute particles as interfering or
standing between the solvent particles.
With greater space between solvent particles, intermolecular forces are weaker.
Consequently, lower
temperatures are required to make it possible for solvent particles to approach
each other and form the solid. It is important to
note the identity of solute particles isn't specified. That is,
an aqueous 0.50 m C6H12O6
solution should have the same freezing point as an aqueous 0.25 m NaCl
solution, since each formula unit of NaCl provides two ions in solution.
In today's experiment, you
will first determine the freezing point of the t-butyl
alcohol by cooling it in cold water. You will then add
a solute to the alcohol and measure the freezing point of
the solution. After determining the freezing point and actual
ΔTf
of the solution, and
the masses of solute and solvent,
you should be able to
determine the Kf of the solvent.
Procedure
-
Connect a temperature probe to
Channel 1 of the LabPro interface and launch the Logger Pro and Excel
applications. Set your experiment parameters to the "Time
Based" mode,
with an experiment length of 10 minutes and a sampling rate of
10 samples/min.
-
Measure and record the mass of
a clean, dry large test tube
(why is it important for the test tube to be very clean
and dry in this lab?) by standing it in a beaker or an Erlenmeyer
flask. Using a graduated cylinder, pour 20 mL of
t-butyl
alcohol into the test tube and
measure the new mass. Determine the mass of
t-butyl
alcohol added. Data that is not collected by Logger Pro should
be entered into your laboratory notebook and an Excel spreadsheet.
-
Prepare an
ice water bath in a 400-mL beaker.
Clamp the test tube to ring stand. Insert a clean, dry copper stirrer into
the test tube and clamp a clean, dry
temperature probe
into the test tube. Make sure that the probe does not touch the walls of the test tube and
yet is still well-immersed in the liquid. The copper stirrer should surround
the probe.
-
Prepare
a warm/hot water bath to warm the liquid in the test tube to a temperature
between 40-50°C.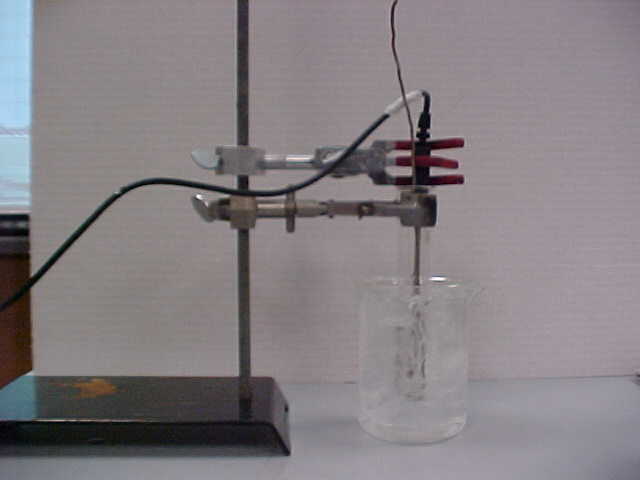
-
When you are ready to begin
data collection, click on the "Collect" button. Quickly lower the
test tube into the cold water bath (see right).
Continuously stir the contents of the test tube with an up/down motion. Make
sure the probe remains in the liquid and that it does not come into contact
with the walls of the test tube. Stir as long as possible, allowing the data
collection to continue until the temperature levels off
or a long, gradual slope is obtained (see figures below). Remove the test tube from
the cold water bath and place it in a beaker of warm/hot water
bath to thaw
the solid.
- Under the Experiment menu, select Store
Latest Run. Also, save your file to disk, or
to a directory
specified by your instructor. Saving early and often prevents any accidental
data loss.
- Repeat steps 4-6 so that
you have obtained two trials for the pure
t-butyl
alcohol.
- Remove the test test tube
from the clamp and dry it thoroughly. To account for any
t-butyl
alcohol that may have evaporated or otherwise been lost, measure
and record the mass of the test tube and contents on the same balance as
before to determine the mass of
t-butyl
alcohol
remaining. Add 1.00-1.50 grams of solute to the
t-butyl
alcohol.
Use a dropper to
add a liquid or a spatula to add a solid. Measure and record the precise mass
used by reweighing the test tube and contents.
Clamp the test tube into place with the
clean and dry stirrer and
probe assembly. Mix the contents of the test tube
thoroughly to ensure the complete dissolution of the solute. Make sure the
solute is completely dissolved
before proceeding.
- Replace any melted ice in
the ice water bath. Then repeat steps 4-6. Repeat steps 4-6
again to obtain two trials for the solution.
- Dispose of the solution in the the designated waste
container. Wash and thoroughly dry the test tube, probe, and stirrer.
Data Analysis
Goal: (1) To determine the freezing point for
the pure solvent and for each of two solutions. (2) To use these temperatures to determine
the freezing point depression constant, Kf,
of the solvent.
As the
pure solvent cools, its temperature drops. This is illustrated in
the graph to the lower left. During the conversion of liquid to solid, the
temperature remains relatively constant and a plateau in the cooling curve is
observed. Using your data, use Logger Pro to find the average of the
temperatures on the plateau. Record this temperature as the freezing point
of
t-butyl
alcohol.
 |
 |
-
The freezing point of a solution is the temperature
at which crystals
just begin to form. As additional solid forms, the temperature continues to
drop. This
behavior is illustrated in the graph to the above right.
Since the
temperature probe is unable to respond instantly to temperature changes, the thermometer records a gradual change in
temperature instead of the abrupt change in temperature that should be observed
at the instant crystals begin to form. Consequently, the
graph is rounded in the vicinity of the appearance of crystals.
To compensate for the slow response of the thermometer, the
solution's freezing point is determined graphically. To do this, you will
need to obtain the equations for each of the two "straight-line"
series of your solution's cooling curve.
The first series includes data obtained
as the solution cools and approaches the freezing point. The second series includes
data obtained as the solution
solidifies. Use Logger Pro to perform a linear regression analysis on each of the two series and
determine where the two regression lines intersect. (You may do this by solving the equations of each of the
regression lines simultaneously
or by substitution, or by zooming in on the intersection of the two lines on
the graph). This
intersection corresponds to the freezing point of the solution. You will need
to perform this type of analysis for
each of the solutions in your experiment.
Calculations and Questions
- Calculate the molality
and the freezing point depression for each trial of
the solutions.
- Using the molality and the freezing point depressions,
calculate the freezing point depression constant for each trial of the
solutions. Find the average value for Kf
based on your data and
submit your average
Kf values before leaving the
lab (or within 24 hours with instructor approval).
- Gather the
all of the Kf
values from your lab section and calculate
the average value of Kf for t-butyl
alcohol.
- Using the class average for
Kf
and the freezing point of pure t-butyl alcohol determined in the
lab, what is the molecular weight of a substance that yields a freezing
point of 18.2°C when
1.06 g of the substance was dissolved in 18.36 g of t-butyl alcohol?
- A skyscraper in Pittsburgh, built in the early 1970s is supported by water
filled columns. Potassium
carbonate was added to the water to prevent freezing during cold weather. If
the solution is 40.0% K2CO3 by
mass, what is the predicted freezing point of this solution in °C, assuming full
ionization?
- Melting point temperatures are frequently used to help identify unknown
solids and determine their purity. How would the melting
point of a pure solid sample compare to that of the
same solid contaminated by a solid impurity?
Explain.
Lab Report
You may choose to submit an individual or group report for this lab.
Follow
the guidelines for
Laboratory
Reports located at
http://webs.anokaramsey.edu/chemistry/Chem1062. Your report should include a
title, procedure,
results, and discussion. Make sure that your graphs include
titles, axes labels, regression line equations, trendline equations, etc.
Move equation boxes so that they do not cover each other up. While there are no formal questions for you
to answer in the discussion, it should show that you have thought about the
data which you have collected and how well you performed the lab overall. The answers to questions three through five should be given in an appendix
at the end of the report.
Follow your instructor’s directions for submitting this lab
report. Remember to name the file as specified (Lastname_FPDepression or
Lastname1_Lastname2_FPDepression). If you are
emailing your report, use the subject line “Chem 1062:
FP Depression Lab”. If you worked in pairs and are
submitting this assignment on an individual basis,
please underline your own name and include your lab partner’s
name on the assignment.
Include one set of sample
calculations for one of the trials, either handwritten or typed
(preferably in Equation 3.0 or a similar program). Alternatively,
use an Excel
spreadsheet embedded into your
Word
document
if you will be submitting your report electronically to your professor, since
your work would be shown in the cell formulae.
This will enable the professor to view the formulas in each of your
spreadsheet cells rather than having you write them out.
Lab developed by the
Anoka-Ramsey Community College Chemistry Department. Portions of this lab were written by Kirk Boraas, Minneapolis Community and
Technical College. Last updated
April, 2011.